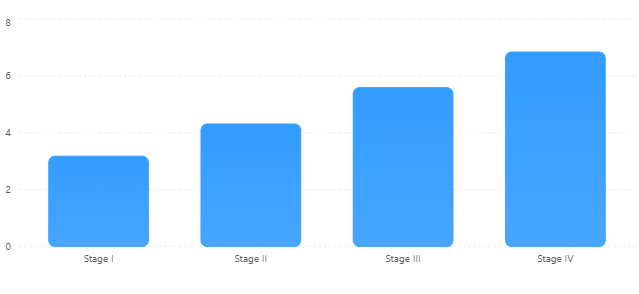
Figure 1: TP53 Expression across Clinical Stages (Mean ± SD)
Maryum Qayyum1* | Kashif Shahbaz1 | Khadija Ahmed2 | Mubeen Anjum2
1Superior University, Lahore, Pakistan | 2Department of Biosciences, COMSATS University, Islamabad, Pakistan
*Correspondence: Maryum Qayyum ([email protected])
Received: 10 April, 2026; Revised: 30 May, 2026; Accepted: 04 June, 2026; Published: 10 June, 2026
Background: Breast cancer is the most prevalent malignancy in women worldwide and remains a major cause of deaths due to cancer. This study measured TP53 gene expression in patients with breast cancer and to determine its possible diagnostic value in breast cancer patients by correlating the TP53 gene expression with clinical and pathological parameters. Methodology: This was a case-control study with 80 participants; 60 patients with histopathologically confirmed breast cancer and 20 healthy female controls. Peripheral blood and tumor tissue specimens were taken for molecular studies. The TP53 gene expression level was measured by real-time polymerase chain reaction (RT-PCR) using comparative Ct method. Statistical analysis was carried out by SPSS version 22.0 (p < 0.05 level). Results: The TP53 expression was considerably higher in breast cancer patients, by comparing healthy controls (4.82 ± 1.76 vs. 1.21 ± 0.54-fold change, p < 0.001). Both tumor stage (r = 0.58, p < 0.001) and histological grade (r = 0.49, p < 0.001) were positively interrelated with TP53 expression. The ROC curve analysis showed an area under the curve (AUC) of 0.89, sensitivity of 85.0% and specificity of 80.0%. The expression of TP53 was an independent predictor of breast cancer status identified by logistic regression (OR = 4.72, 95% CI: 2.01–11.08, p < 0.001). Conclusions: TP53 expression in breast cancer patients is significantly different and has good diagnostic value. It is correlated with the following clinicopathological parameters, which indicates its role in the advancement of tumor.
Keywords: Breast cancer, TP53, gene expression, RT-PCR, biomarker, molecular diagnostics, tumor suppressor gene
Breast cancer is the most prevalent cancer in women globally and is one of the major causes of cancer-related deaths in women 1. Although considerable progress has been made in screening, diagnosis, and treatment, the high degree of heterogeneity and different clinical outcomes make breast cancer a significant challenge to public health 2. Breast cancer initiation, growth, invasion and metastasis are influenced by a complex network of epigenetic, genetic and environmental factors. Thus, the need for the identification of reliable molecular indicators has become more and more crucial for the better early diagnosis, prognosis and therapeutic decision-making in breast cancer management 3,4. The TP53 gene is one of the most extensively studied genes involved in breast cancer. TP53 is the gene that codes for the p53 protein, which is an important tumor suppressor that helps control cell growth, DNA repair, apoptosis, cell genomic stability and cell stress 5.
Mutations in TP53 can cause cells to grow out of control, to accumulate mutations and to develop into tumors. TP53 mutations are found in a significant number of breast cancers and are linked to poorer prognosis, therapy resistance and aggressive tumor characteristics 6. Previous studies have shown that TP53 expression or mutation rates vary greatly among breast cancer subtypes. TP53 overexpression has been linked to higher histological grade, prognosis, larger tumor size, lymph node metastasis, prognosis, and advanced clinical stage 7. Additionally, several investigations have hinted of a potential association of TP53 alterations with molecular subtypes of breast cancer, with those that were aggressive 8. In addition, molecular diagnostic techniques like quantitative real-time PCR (RT-PCR) have improved the ability to quantify a TP53 gene and to evaluate it as a diagnostic and prognostic biomarker 9,10.
Although numerous studies have examined TP53 alterations in breast cancer, variations in gene expression patterns and their relationship with clinic-pathological characteristics continue to be reported across different populations. The current study was designed to assess the expression level of the TP53 gene in patients with breast cancer by quantitative RT-PCR and to assess the diagnostic value. The study also aimed to explore the relationship between the expression of TP53 and clinic-pathologic variables such as tumor size, lymph node status, histological grade, lymph node status, clinical stage, and molecular subtypes to understand the effect of TP53 as a biomarker of breast cancer progression and diagnosis.
This is a case-control study to assess the expression profile of the TP53 gene and its diagnostic potential in breast cancer patients. Eighty women were included in the study: 60 breast cancer patients and 20 age-matched healthy controls histopathologically confirmed. The study population comprised patients from affiliated Oncology and Breast Surgery departments of tertiary care hospitals from September 2021 to March 2022. Prior to the study, the institutional ethics review committee gave ethical clearance. All participants gave written informed consent before being enrolled. Patient information was kept confidential and anonymous throughout the study, and all procedures followed the ethical recommendations for biomedical research with human participants.
Patients for the group included women over the age of 18 diagnosed with breast cancer for the first time or had already been diagnosed with breast cancer. Breast tissue diagnosis confirmed the diagnosis. The control group comprised of healthy female volunteers who have no history of breast cancer, other cancers, and chronic inflammatory diseases. Individuals who had undergone neoadjuvant chemotherapy for the patients before sampling or had recurrent malignancies or concurrent cancers or severe systemic illnesses, autoimmune disorders, or inadequate clinical records were excluded from the study. People who did not give informed consent were also not included.
Data pertaining to clinical and pathological information such as age, size of tumor, histological grade, clinical stage, lymph nodes status, and molecular subtype was obtained from medical records and pathological reports. The samples of peripheral blood as well as tumor tissue were taken in the standardized conditions. Commercial kits were utilized to isolate total RNA. Concentration of isolated RNA and purity was evaluated spectrophotometrically. The complementary DNA (cDNA) was produced by reverse transcription and quantitative real-time polymerase chain reaction (RT-PCR) was used to measure TP53 gene expression. The comparative 2-ΔΔCt method was utilized to measure relative gene expression with the use of an appropriate housekeeping gene as an internal reference. The primers were constructed by serial cloner of required genes from NCBI using the consensus CDS sequence. The primer sequences were confirmed by utilizing In-Silico PCR on UCSC Genome Browser.
TP53 Primer Sequences:
Forward Primer (5' → 3'): 5'-GAGCTGAATGAGGCCTTGGA-3'
Reverse Primer (5' → 3'): 5'-CTGAGTCAGGCCCTTCTGTCTT-3'
Quantitative real-time polymerase chain reaction (RT-PCR) was performed with 2× SYBR Green Master Mix following the manufacturer's specifications. The housekeeping gene, GAPDH, was used for normalization of gene expression data. A total of 20 µL of reaction volume was used for each reaction, with cDNA template, gene-specific primers, SYBR Green master mix, and nuclease-free water. Amplification was carried out using optimized thermal cycling conditions comprising an initial denaturation step and 40 cycles of denaturation, annealing, and extension. The relative TP53 gene expression was determined by the comparative 2^−ΔΔCt method, with all reactions run at least three times for accuracy and reproducibility.
The IBM SPSS version 22.0 was utilized for the analysis of data. Data was presented as mean ± SD, frequencies and percentages. The expression of TP53 was analyzed by independent sample t-test between breast cancer patients and controls. One-way analysis of variance (ANOVA) was used to determine the differences in expression levels between the clinicopathological groups. Pearson correlation analysis was used to analyze the associations between TP53 expression and clinical variables. Diagnostic performance of TP53 expression was measured by receiver operating characteristic (ROC) curve analysis and logistic regression was used to identify independent predictors of the breast cancer status. The significance of the data was determined by the p-value < 0.05.
Eighty participants were enrolled in the study, including 60 histopathologically proven breast cancer patients and 20 healthy controls. The average age of breast cancer patients was 51.4 ± 10.8 years, while the average age of controls was 48.7 ± 9.6 years. TP53 expression levels were significantly elevated among breast cancer patients compared with controls and showed significant associations with several clinicopathological characteristics. Table I displays the clinic-pathological features of the study subjects. The age range of the 60 patients of breast cancer was 40-59 years, and the majority of patients had tumors larger than 2 cm. The most common histological type was grade II, and over 58% of the patients had lymph node involvement. The majority of the cases (63%) were diagnosed at stage II or III disease.
| Variable | Category | Breast Cancer Patients (n=60) | Controls (n=20) |
|---|---|---|---|
| Age (years) | Mean ± SD | 51.4 ± 10.8 | 48.7 ± 9.6 |
| Age Group | <40 years | 11 (18.3%) | 5 (25.0%) |
| 40–59 years | 33 (55.0%) | 10 (50.0%) | |
| ≥60 years | 16 (26.7%) | 5 (25.0%) | |
| Tumor Size | ≤2 cm | 18 (30.0%) | — |
| >2 cm | 42 (70.0%) | — | |
| Histological Grade | Grade I | 12 (20.0%) | — |
| Grade II | 30 (50.0%) | — | |
| Grade III | 18 (30.0%) | — | |
| Lymph Node Status | Positive | 35 (58.3%) | — |
| Negative | 25 (41.7%) | — | |
| Clinical Stage | I | 10 (16.7%) | — |
| II | 24 (40.0%) | — | |
| III | 18 (30.0%) | — | |
| IV | 8 (13.3%) | — |
Figure 1: TP53 Expression across Clinical Stages (Mean ± SD)
A progressive increase in TP53 expression was observed with advancing clinical stage, as shown in Figure 1. Error bars indicate standard deviation, highlighting increasing biological variability in advanced disease.
Table II shows the comparison of TP53 gene expression levels between breast cancer patients and controls. Breast cancer patients had a considerably higher TP53 expression, and there was a mean fold change of almost 4 times the expression of TP53 in comparison to controls. The difference was exceedingly significant (p<0.001), which means that there is a strong correlation between breast cancer and altered expression of TP53. The results indicate the feasibility of TP53 expression profiling for future diagnosis.
| Group | Mean TP53 Expression (Fold Change ± SD) | t-value | p-value |
|---|---|---|---|
| Breast Cancer Patients (n=60) | 4.82 ± 1.76 | 9.87 | <0.001 |
| Healthy Controls (n=20) | 1.21 ± 0.54 |
Table III displays the association of TP53 expression with the major clinicopathological parameters. TP53 expression was higher in patients with larger tumors, high histological grade, positive status of lymph node and advanced clinical stages. The extent of expression was found to increase with the stages of disease (I-IV). Our results indicate that TP53 expression might be related to aggressiveness and progression of the tumor.
| Variable | Category | Mean TP53 Expression ± SD | p-value |
|---|---|---|---|
| Tumor Size | ≤2 cm | 3.71 ± 1.20 | 0.003 |
| >2 cm | 5.29 ± 1.81 | ||
| Histological Grade | Grade I | 3.42 ± 1.08 | <0.001 |
| Grade II | 4.68 ± 1.37 | ||
| Grade III | 6.12 ± 1.75 | ||
| Lymph Node Status | Positive | 5.56 ± 1.62 | 0.001 |
| Negative | 3.78 ± 1.28 | ||
| Clinical Stage | I | 3.18 ± 0.92 | <0.001 |
| II | 4.31 ± 1.24 | ||
| III | 5.59 ± 1.53 | ||
| IV | 6.84 ± 1.87 |
The correlation between TP53 expression and clinical parameters of patients of breast cancer are presented in Table IV. There was notable positive correlation with histological grade, tumor size, involvement of lymph node and clinical stage. The best correlation was with the disease stage and showed an increase in TP53 expression as the disease progressed. There was no significant relationship between the age of the patients and the expression of TP53.
| Variable | Correlation Coefficient (r) | p-value |
|---|---|---|
| Age | 0.16 | 0.218 |
| Tumor Size | 0.41 | 0.001 |
| Histological Grade | 0.49 | <0.001 |
| Lymph Node Involvement | 0.45 | <0.001 |
| Clinical Stage | 0.58 | <0.001 |
Table V shows how well TP53 expression can discriminate patients of breast cancer from healthy controls. The ROC curve analysis showed high discriminatory power of the model (AUC = 0.89). The expression of TP53 showed a high sensitivity, specificity and overall diagnostic accuracy. Based on these findings, TP53 might be regarded as a promising molecular marker for the breast cancer diagnosis.
| Parameter | Value |
|---|---|
| Area Under Curve (AUC) | 0.89 |
| Sensitivity | 85.0% |
| Specificity | 80.0% |
| Positive Predictive Value | 92.7% |
| Negative Predictive Value | 61.5% |
| Diagnostic Accuracy | 83.8% |
| Optimal Cutoff Value | 2.45 Fold Change |
Table VI specifies independent predictors that are related to the breast cancer status. The level of TP53 expression proved to be the most significant predictor with significantly higher breast cancer risk. There was also a significant relation with tumor size and histological grade, but not with age. The regression model was found to be statistically significant and showed a good explanatory power.
| Variable | Odds Ratio (OR) | 95% CI | p-value |
|---|---|---|---|
| TP53 Expression | 4.72 | 2.01–11.08 | <0.001 |
| Age | 1.08 | 0.97–1.19 | 0.142 |
| Tumor Size | 1.84 | 1.02–3.31 | 0.041 |
| Histological Grade | 2.26 | 1.21–4.22 | 0.009 |
Table VII contrasts the levels of TP53 in the various molecular breast cancer types. The expression was lowest in Luminal A and progressively up in Luminal B and HER2-enriched tumors. The highest was seen in triple-negative breast cancer, usually considered highly aggressive. The marked differences between subtypes indicate that TP53 expression could be useful for molecular characterization and prognosis.
| Molecular Subtype | n | Mean TP53 Expression ± SD |
|---|---|---|
| Luminal A | 18 | 3.89 ± 1.12 |
| Luminal B | 17 | 4.71 ± 1.34 |
| HER2-Enriched | 12 | 5.66 ± 1.51 |
| Triple-Negative Breast Cancer | 13 | 6.28 ± 1.88 |
ANOVA: F = 8.73, p < 0.001, indicating significantly higher TP53 expression in more aggressive molecular subtypes, particularly triple-negative breast cancer.
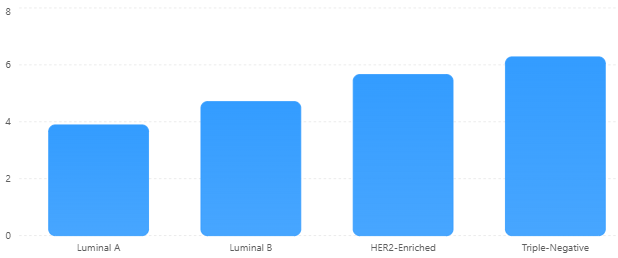
Figure 2. TP53 Expression across Molecular Subtypes (Mean ± SD)
TP53 expression varied considerably across the molecular subtypes, with the maximum levels observed in triple-negative breast cancer, as shown in Figure 2. Error bars (±SD) reflect variability within each subgroup.
Receiver operating characteristic (ROC) curve presenting diagnostic performance of TP53 expression (AUC ≈ 0.89), as shown in Figure 3.
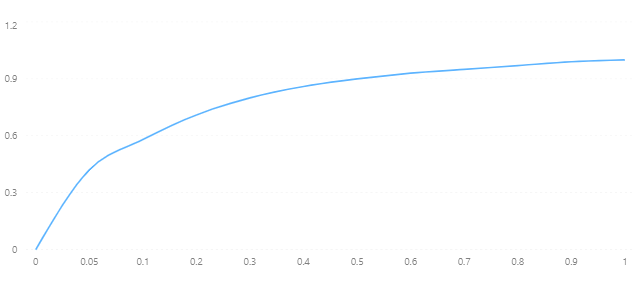
Figure 3: ROC Curve of TP53 Expression for Breast Cancer Diagnosis
The ROC curve demonstrates strong diagnostic performance of TP53 expression in distinguishing breast cancer patients from healthy controls. The curve shows a rapid rise in sensitivity with increasing false positive rate, with an estimated AUC of approximately 0.89, indicating good overall discriminatory ability.
This study aimed to assess the TP53 gene expression in patients with BC and explore the potential diagnostic use of the gene and its correlation with clinicopathological parameters. The results revealed a significantly higher TP53 expression in breast cancer patients than in healthy controls, suggesting the strong association of TP53 dysregulation in breast carcinogenesis. The results indicate that TP53 expression could be a valuable molecular marker for breast cancer diagnosis and prognosis. The high level of expression of TP53 in breast cancer patients is in accord with other reports that show that TP53 abnormalities play a central role in breast tumor development 11.
TP53 is an essential tumor suppressor gene which shows a vital role in regulating cell cycle arrest, DNA apoptosis, repair, and the mechanisms that maintain genomic integrity 12. The disruption of TP53 pathways leads to abnormal growth and malignant transformation of the cells 13. A previous study on breast cancer molecular studies has also indicated much different expression profile of TP53 in breast cancer tissues versus non-cancerous tissues, which also backs up its role in carcinogenesis 14,15. The increase in TP53 expression rate in the present study of approximately 4-fold further confirms the possible utility of TP53 as a molecular marker that could differentiate between malignant and non-malignant entities. Similar results have indicated the potential for early deregulation of TP53 in tumor development, with its expression constantly observed during disease progression 16.
There is a strong correlation between clinicopathological markers of tumor aggressiveness and TP53 expression. Patients with larger tumors, higher histological grades, positive lymph node involvement and advanced disease stages presented considerably higher expression levels of TP53 17. In addition, the correlation analysis showed a significant positive correlation between TP53 expression with histological grade, size of the tumor, lymph node and clinical stage, with the highest degree of correlation with disease stage. These results have been echoed in previous reports, where TP53 mutations have been linked to more aggressive tumor behavior, greater metastatic potential and worse prognosis 18. TP53 expression was found to be progressively higher in each clinical stage of the study, indicating a progressive dysregulation of TP53 as breast cancer develops 19. Similarly, previous studies have presented that elevated levels of TP53 expression are often linked to disease progression, resistance to treatment, and poor prognosis in patients of breast cancer 20,21.
Moreover, TP53 gene expression was found to be significantly different between molecular subtypes as in triple-negative breast cancer it was the highest and in HER2-enriched it was the second highest. This discovery indicates that TP53 dysregulation may be more prevalent with the biologically aggressive breast cancer phenotypes and may be involved in increased genomic instability and tumor progression 22. A higher prevalence of TP53 mutations has been reported in triple-negative breast cancer, in which the TP53 gene is suggested to play a role in poor prognosis and limited treatment options 22. The logistic regression analysis also showed that the expression of TP53 was an independent predictor for breast cancer status, suggesting that higher expression of TP53 significantly increased the risk of disease. Previous studies have also indicated that molecular changes involving TP53 may offer additional diagnostics information, which extends beyond the traditional clinicopathological parameters, and may be useful in risk stratification for breast cancer patients 24.
There are certain limitations of the study. Small sample size and case-control design may limit generalizability of the results and ability to establish causality. Furthermore, TP53 mutation analysis and protein expression studies were not conducted and this may yield further information regarding the biological relevance of altered gene expression. Further validation of the diagnostic and prognostic value of TP53 expression in larger patient cohorts in multicenter studies and longitudinal follow-up is recommended, along with integrated molecular analyses for the future use of TP53 expression in personalized breast cancer management or precision oncology strategies.
The increased expression of the TP53 gene was shown to be statistically significant in breast cancer patients as compared to the healthy controls and it was was statistically strongly correlated with poor clinicopathological features such as larger tumour size, higher histological grade, lymph node involvement and advanced clinical stage. Levels of TP53 expression also differed greatly between molecular subtypes; the highest levels of TP53 expression were seen in HER2-enriched and triple-negative breast cancers, which are more aggressive tumor phenotypes.
Acknowledgement
None
Conflict of Interest
None
Grant Support & Funding Source
None
Use of Artificial Intelligence
The corresponding author declared that no other artificial intelligence or AI-assisted tools were used anywhere in this manuscript.
Authors’ Contribution
MQ: Study conceptualization, experimental design, clinical data, drafting and final approval. KS: Methodology design, experimental procedures, statistical analysis and final approval. KA: Patient follow-up, laboratory investigations, drafting the methodology and results, data validation, critical revision of the manuscript for intellectual content, and final approval. All Authors contributed as per ICMJE.

Journal of Biomolecules, Pathogenesis and Therapeutics, J Biomol Pathog Ther. 2026;2(2), p69-71 (jbptjournal.org) © 2026 Authors. This work is published by Multidisciplinary Scholarly Advancement and Research MSAR Institute. The full terms of Journal Publishing policy is available at https://jbptjournal.org/index.php/jbpt/-publishing-license and incorporate the Creative Commons Attribution – Non Commercial (CC BY, NC 4.0) License https://creativecommons.org/licenses/by-nc/4.0/. By accessing the work you hereby accept the Terms. Non-commercial uses of the work are permitted without any further permission, provided the work is properly attributed. Publisher’s Note: MSAR Institute remains neutral with regard to jurisdictional claims in published maps and institutional affiliations, and assumes no liability for the scientific accuracy or clinical efficacy of the content herein, as they rest entirely with the authors.